
We have rebalanced BLX in accordance with our pre-set structure. We added VeChain ($VET) with a weight of 0.29%. The Graph ($GRT) and Maker ($MKR) have fallen out of our structure parameters. Among existing assets, the main changes were with Binance Coin ($BNB) and Solana ($SOL), which stand at 9.55% and 6.41% weight, respectively. $BTC and $ETH reset to 40% and 30%.
Back to Strategies
Blockchain Index Strategy Performance
Blockchain Index Strategy Performance
Risk warning
|Data Disclosure
From
Apr 25, 2024
To
May 2, 2024
Blockchain Index
Bitcoin
About this Strategy
About this Strategy
Blockchain Index is a passively managed Crypto Strategy investing in established blockchain-based projects with active beta components. The Crypto Strategy is market-cap weighted, with fix BTC and ETH weight. The focus of the investment selection is on nascent projects with potential strategic importance in the future distributed economy.
Performance & Risk
Performance & Risk
Annualised Return
+68.38%
Max. Drawdown
-92.35 %
Return
-6.64 %
Volatility
+1.93 %
Structure
Structure
Structure changes
Structure changes
Last structure change
May 1, 2024, 1:12:37 PM
Number of structure change in the last 30 days
1
Posts
Blockchain Index
30 Apr, 2024
Market Recap: Bitcoin and Ethereum Experience Decline
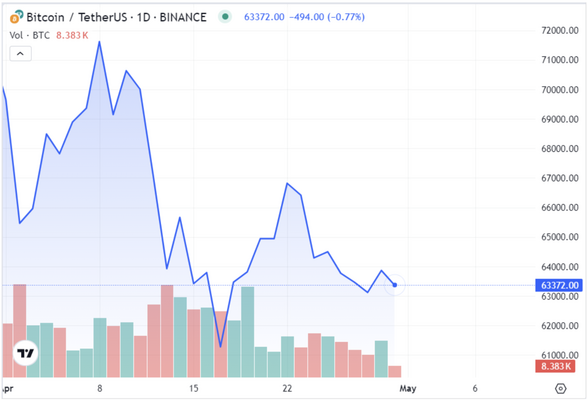
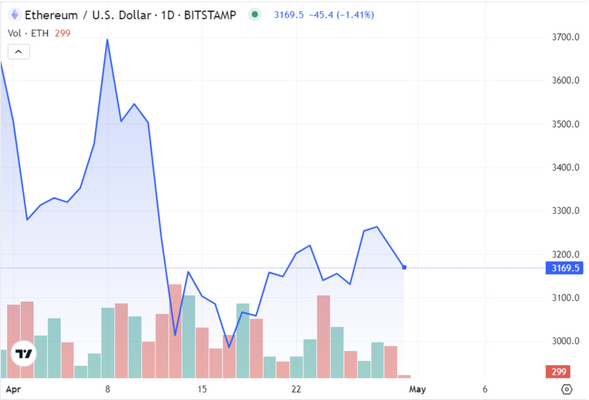
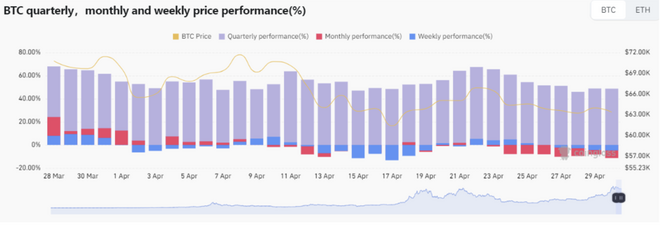
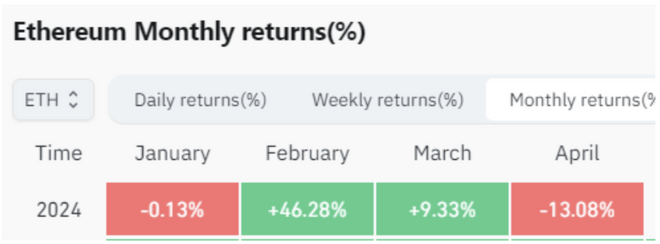
In April, the cryptocurrency market saw fluctuations with Bitcoin and Ethereum witnessing a decline in value. Bitcoin slipped to $62,890, a decrease of 10.89%, while Ethereum fell to $3,146, a drop of 13.21%. The global cryptocurrency market cap also decreased to approximately $2.31 trillion over the last 24 hours. This downward trend was attributed to various factors including low demand from Spot ETFs and negative investor sentiment, especially concerning a potential post-halving crash. Market analysts highlighted these concerns.
BTC and ETH Technical Analysis
Technical analysis of Bitcoin (BTC) and Ethereum (ETH) reveals key insights into their price movements. BTC remained below the 50-day Exponential Moving Average (EMA) while holding above the 200-day EMA, confirming a bearish near-term but bullish longer-term trend. A breakout above the $64,000 resistance level could signal a move towards $69,000, while a drop below the $60,365 support level may lead to a test of the $58,000 handle. The 14-Daily Relative Strength Index (RSI) reading for BTC suggests a potential drop to $58,000 before entering oversold territory.
3 people like this
Blockchain Index
30 Apr, 2024
On the other hand, $ETH held above both the 50-day and 200-day EMAs, affirming bullish price signals. A breakout above the $3,400 handle could push ETH towards $3,835, while a break below the 50-day EMA and the $3,244 support level may lead to a test of the $3,033 support level. The 14-period Daily RSI reading for ETH indicates a potential return to $3,500 before entering overbought territory.
3 people like this
Blockchain Index
30 Apr, 2024
It's crucial to consider key support and resistance levels, as well as indicators like moving averages and RSI. For $BTC, the $58,000 support level remains critical, with potential downside targets if breached. Conversely, a breakout above $64,000 could signal further bullish momentum.
3 people like this
Blockchain Index
30 Apr, 2024
Similarly, for ETH, the $3,240 support level is significant, while a breakout above $3,400 could lead to further upside towards $3,840. Traders should closely monitor these levels and indicators for potential trading opportunities in the coming days and weeks.
3 people like this
Learn more
How To Buy CryptoCrypto Portfolio ManagementFor BusinessesPlatform FeaturesAffiliate programLong-term investingBlogFees DisclosureRisks DisclosureHelp CenterCrypto Live Prices
Bitcoin price USDEthereum price USDDoge price USDCardano price USDSolana price USDGet in touch
Trading office:
256-260 Old Street, London EC1V 9DD
Open: By appointment only
B2B sales and inquiries:
+44 (0) 20 3376 0820Contact SupportSuggest a feature© 2024 ICONOMI Limited
©ICONOMI is the trading name of ICONOMI Limited, a company registered in England and Wales. Registered address 8 Coldbath Square, London EC1R 5HL, United Kingdom. Company Registration number: 11087795. ICONOMI Limited is registered with the Financial Conduct Authority (Firm Reference No. 927859).